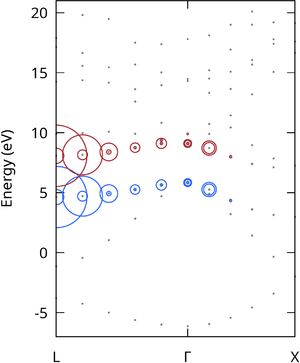
Plot BSE fatbands
It can be useful to inspect which electron-hole pairs or transitions contribute the most to a particular exciton [1]. In VASP it is possible to write the lowest NBSEEIG eigenvectors into the BSEFATBAND file, which can be used for making a fatband structure plot.
For example, a fatband structure plot for the first bright exciton can be made following these steps:
- Perform a BSE calculation with NBSEEIG sufficiently large to include the exciton of interest.
- Find the energy of the first bright exciton in vasprun.xml, i.e., the first transition with non-zero oscillator strength (<varray name="opticaltransitions" >)
- Find the BSE eigenvector corresponding to this transition in the BSEFATBAND file.
- Extract the coupling coefficients Abs(X_BSE) (Column 6) and energies (Column 4 and 5) corresponding to k points (Columns 1-3) along high-symmetry paths.
- Plot the band structure with point size corresponding to the coupling coefficients Abs(X_BSE), i.e.,
|k-point|     hole        electron       Abs(X_BSE)
           eigenvalue    eigenvalue
    x          y1            y2        circle radius
You can use the following script for extracting the NBSE eigenvector along G-L and G-X directions in Si:
#!/bin/bash
#Select the BSE eigenvector of interest.
NBSE=1
# The BSE product basis size.
BSIZE=$(head -n 1 BSEFATBAND | awk '{print $1}')
i=`echo "($BSIZE+1)*$NBSE+1" | bc`
#Cut out the selected eigenstate.
head -n $i BSEFATBAND | tail -n $BSIZE > BSE-$NBSE.dat
awk < BSE-$NBSE.dat '{ if ($1==$2 && $3==$2)  print sqrt($1*$1+$2*$2+$3*$3), $4, $5, $6}' > bands-GL.dat
awk < BSE-$NBSE.dat '{ if ($1==$3 && $2==0.0) print sqrt($1*$1+$2*$2+$3*$3), $4, $5, $6}' > bands-GX.dat

The fatband structure plot can be done in gnuplot by running the following script:
set size 0.5,1
set nokey
set ylabel "Energy (eV)"
set yrange[-7:21]
set xtics ("L" -0.866025, "Г" 0, "X" 0.707107)
set xrange[-0.866025:0.707107]
M=0.001

 p "bands-GL.dat" u (-$1):2:(M*($4)) w circles lc rgb "#2C68FC", \
               "" u (-$1):3:(M*($4)) w circles lc rgb "#A82C35", \
               "" u (-$1):2 ps 0.5 lc "#808080" w d,  \
               "" u (-$1):3 ps 0.5 lc "#808080" w d,  \
   "bands-GX.dat" u 1:2:(M*($4)) w circles lc rgb "#2C68FC", \
               "" u 1:3:(M*($4)) w circles lc rgb "#A82C35",  \
               "" u 1:2 ps 0.5 lc "#808080" w d,      \
               "" u 1:3 ps 0.5 lc "#808080" w d
